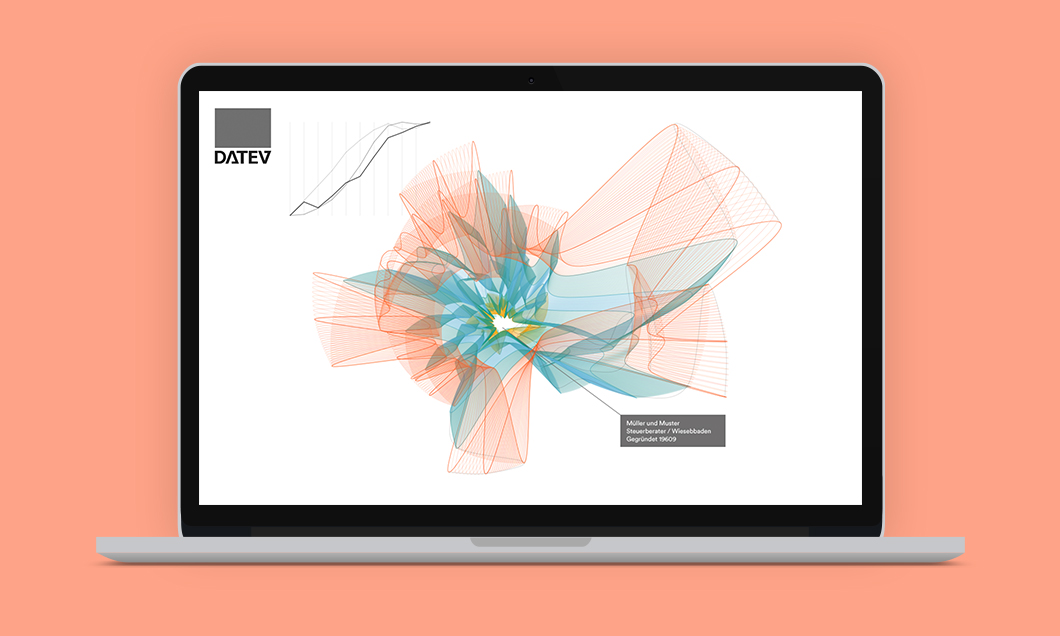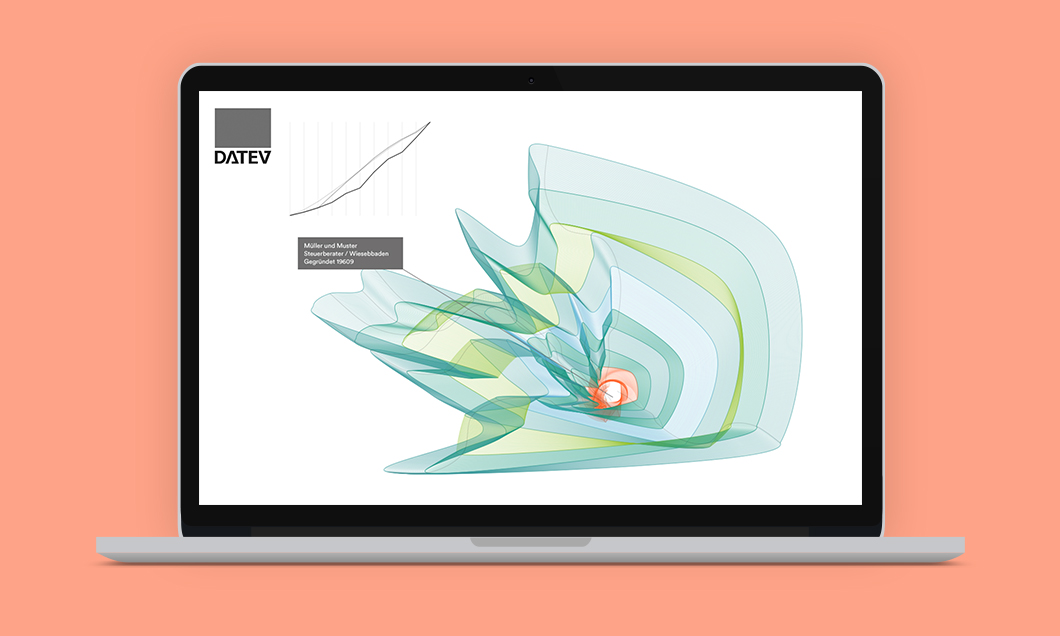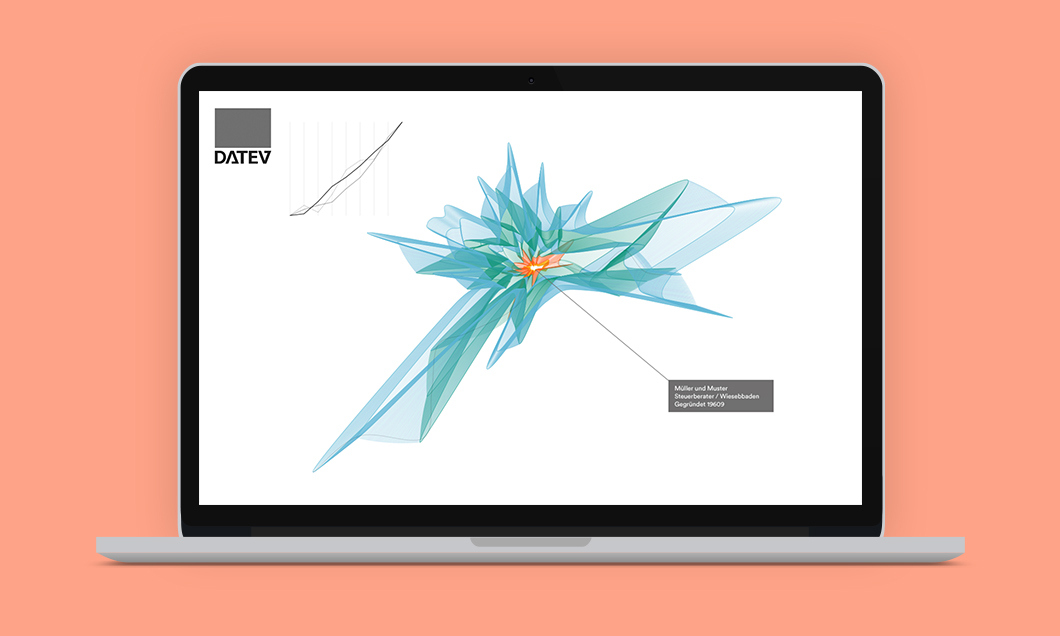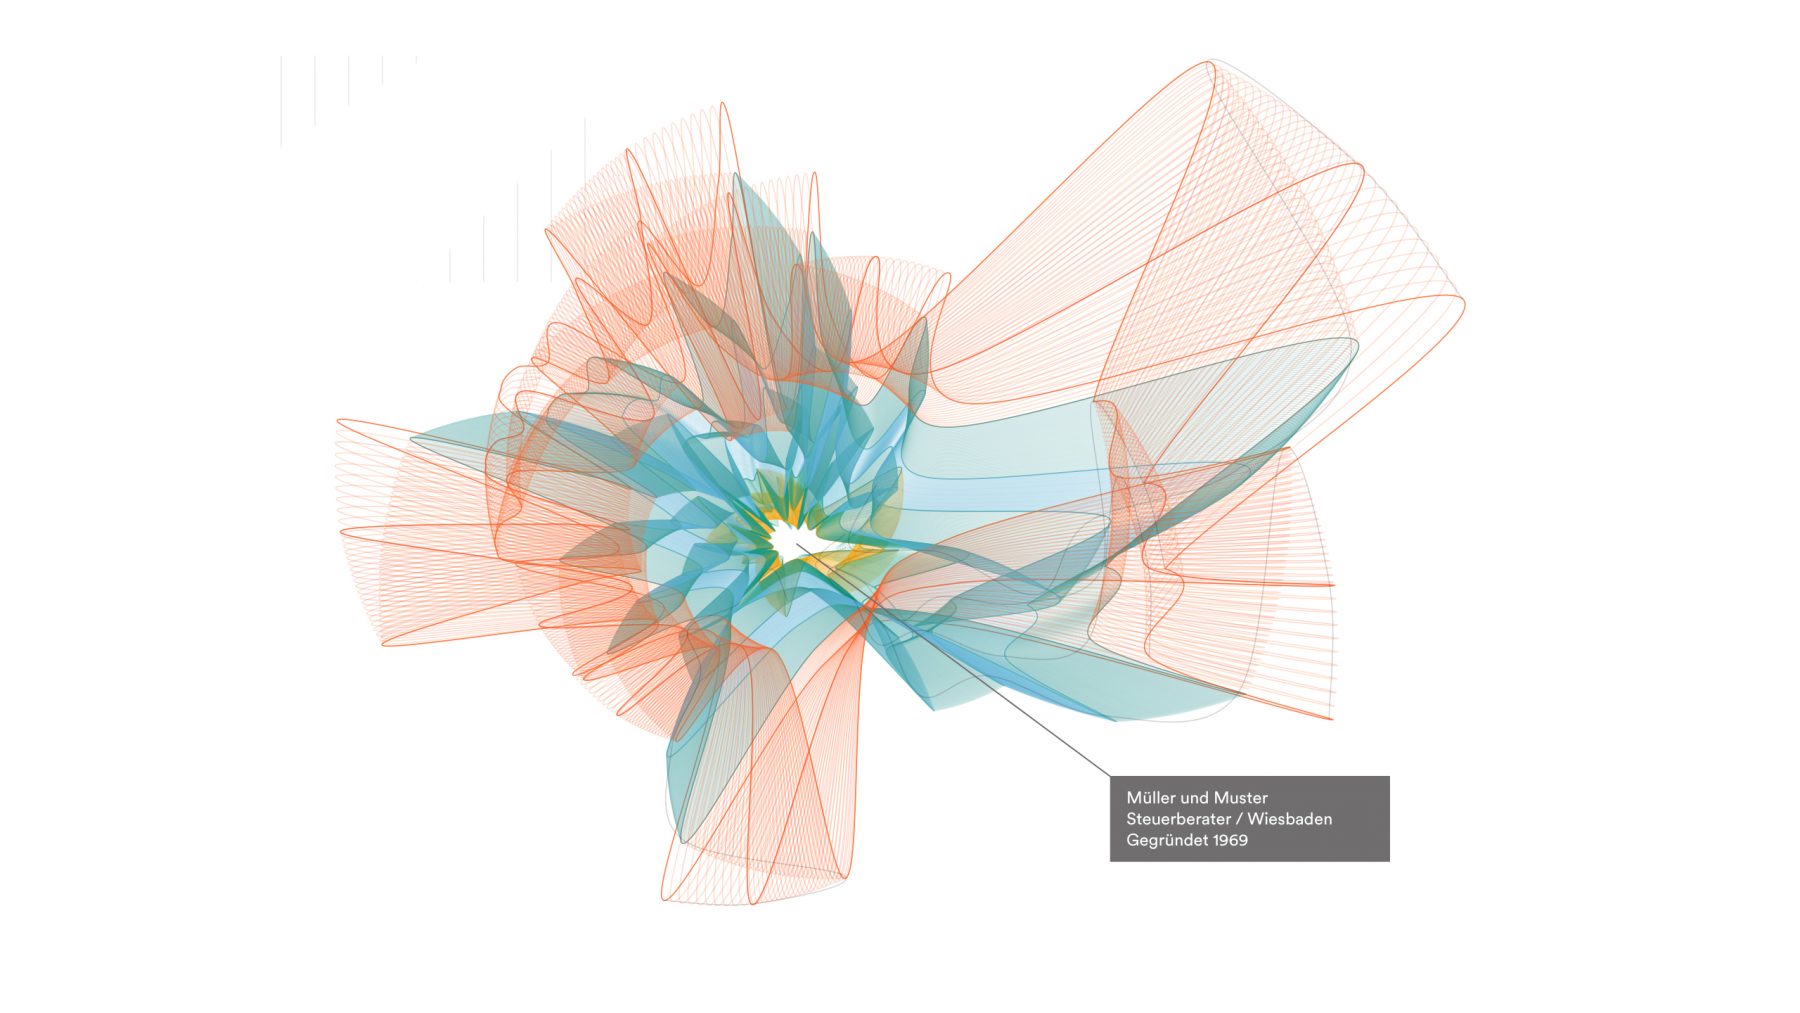
DATEV is the largest IT service provider for tax advisors, auditors and accountants in Germany. Celebrating its 50th anniversary the company commissioned a website allowing visitors to enter some basic data of their own company. The website renders a generative information chart which shows the company in relation to the general economic development of different time periods in history. Visitors could order a print of the visual or download the image together with a reference guide on how to »read« the graphic.
In cooperation with syntop.io